Key Figures
Full details of the latest results can be found in our Annual Report 2025.
Publications Overview
Historical financial data (2022–2025) is available here for download in XLS format.
|
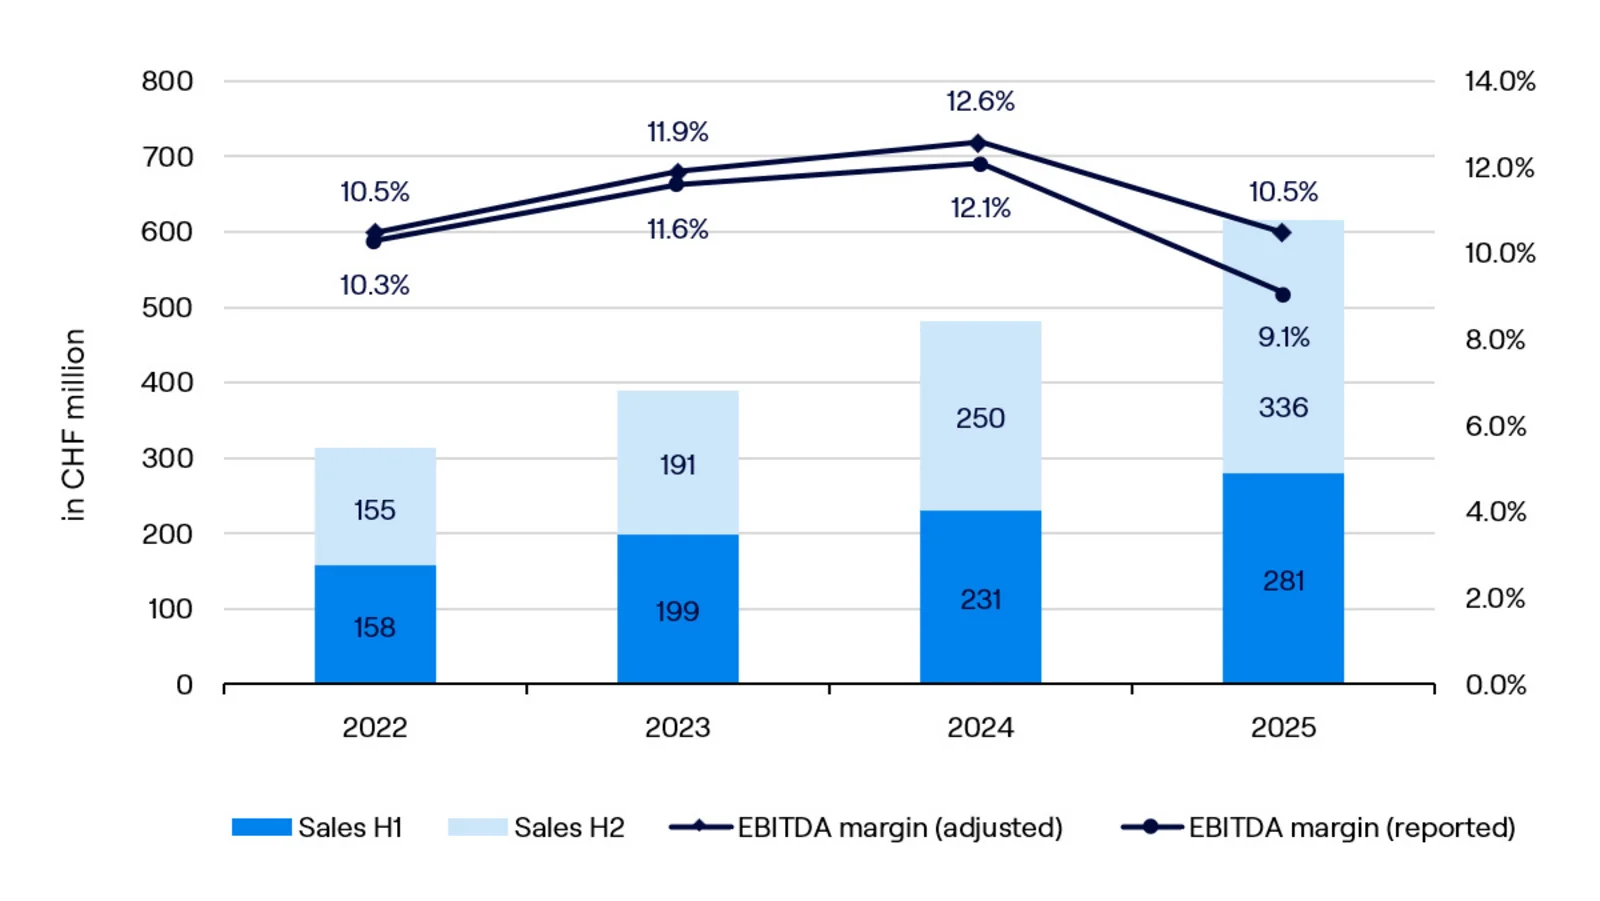
| 2022 | 2023 | 2024 | 2025 |
| Order entry | CHF 1 000 | 358 878 | 399 775 | 440 394 | 644 977 |
| Net Sales | CHF 1 000 | 313 193 | 389 890 | 480 836 | 616 499 |
| Book-to-Bill Ratio |
| 1.15 | 1.03 | 0.92 | 1.05 |
| EBITDA (reported) | CHF 1 000 | 32 274 | 45 135 | 58 353 | 56 261 |
| EBITDA (adjusted) | CHF 1 000 | 32 737 | 46 264 | 60 720 | 64 629 |
| EBITDA margin (reported) | % | 10.3 | 11.6 | 12.1 | 9.1 |
| EBITDA margin (adjusted) | % | 10.5 | 11.9 | 12.6 | 10.5 |
| Operating Profit (EBIT) (reported) | CHF 1 000 | 17 592 | 29 045 | 38 086 | 30 787 |
| Operating Profit (EBIT) (adjusted) | CHF 1 000 | 21 868 | 33 863 | 47 533 | 47 172 |
| Net Profit (reported) | CHF 1 000 | 9 178 | 11 760 | 27 253 | 16 911 |
| Net Profit (adjusted) | CHF 1 000 | 12 391 | 15 525 | 34 480 | 32 668 |
| Earnings per Share (reported) | CHF | 2.47 | 2.66 | 6.20 | 3.85 |
| Earnings per Share (adjusted) | CHF | 3.33 | 3.51 | 7.85 | 7.45 |
| Return on Invested Capital (reported) | % | 8.0 | 11.4 | 14.7 | 10.8 |
| Return on Invested Capital (adjusted) | % | 9.9 | 13.3 | 18.3 | 16.5 |
| Number of Employees | FTE as per 31 Dec | 2 217 | 2 551 | 3 309 | 4 524 |
| Equity Ratio | % | 36.8 | 38.2 | 32.8 | 27.1 |